Energy3D is a simulation-based engineering tool for designing green buildings and power stations that harness renewable energy to achieve sustainable development. Users can quickly sketch up a realistic-looking structure or import one from an existing CAD file, superimpose it on a map image (e.g., Google Maps or lot maps), and then evaluate its energy performance for any given day and location. Based on computational physics and weather data, Energy3D can rapidly generate time graphs (resembling data loggers) and heat maps (resembling infrared cameras) for in-depth analyses. Artificial intelligence is also used to support generative design, engineering optimization, and automatic assessment. At the end of the design, Energy3D allows users to print it out, cut out the pieces, and use them to assemble a physical scale model. Energy3D has been primarily developed to provide a simulated environment for engineering design to support science and engineering education and training from middle schools to graduate schools. As its simulation results are accurate and its user interfaces are friendly, it may also be used as an entry-level energy simulation tool for professionals.
How to cite Energy3D?
Charles Xie, Corey Schimpf, Jie Chao, Saeid Nourian, and Joyce Massicotte, Learning and Teaching Engineering Design through Modeling and Simulation on a CAD Platform, Computer Applications in Engineering Education, 26(4), pp. 824-840, 2018 (DOI: 10.1002/cae.21920)
Solarize Your World
You have probably heard that harvesting the sunshine on just a small portion of the world's land would provide enough energy for everyone and thereby solve numerous problems humanity is facing.
But why hasn't this happened? What would it take to make it happen? The Solarize Your World project represents a new effort to engage the public, particularly today's students who will become tomorrow's engineers,
in this important conversation.
The following map (full screen) shows the worldwide distribution of solar power systems currently available in the Virtual Solar Grid,
ranging from small rooftop photovoltaic solar systems to large utility-scale concentrated solar power plants. You can click a marker for a preview and download the Energy3D model it links to.
Any Energy3D user can easily contribute to the Virtual Solar Grid and, as an international community, we will crowdsource an unprecedentedly fine-grained, time-dependent, and multi-scale
computational model for anyone — believer and skeptic of renewables — to study how much of humanity's energy need can be realistically met by solar power on the global scale,
independent of any authority and in the spirit of citizen science.
As a target, the world's electricity consumption in 2016 is a bit more than 20 PWh, or 20,000,000 GWh.
For Energy3D users, the Virtual Solar Grid works a bit like a game.
When new solar power systems are added to the Virtual Solar Grid, their contributors will rise in the scoreboard (if they choose to identify themselves through a name or ID).
Please join us to start a journey to solarize your world and imagine the future!
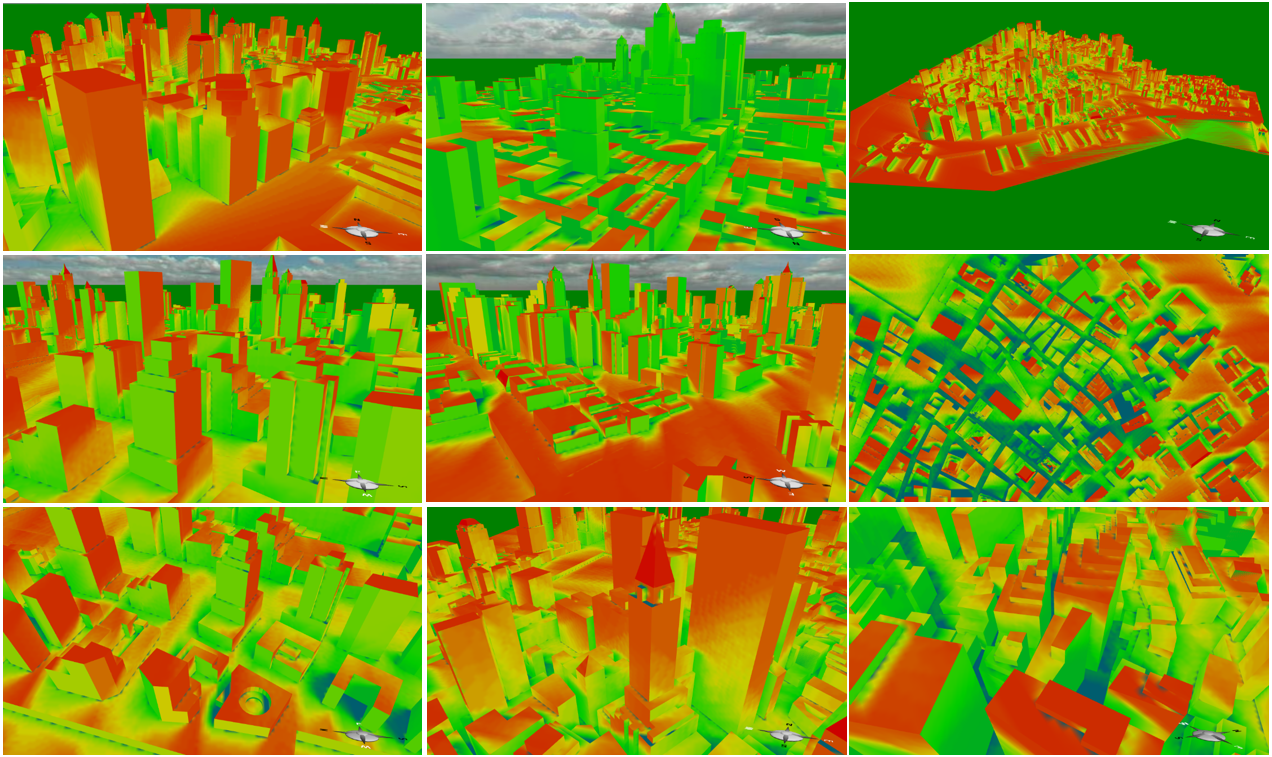
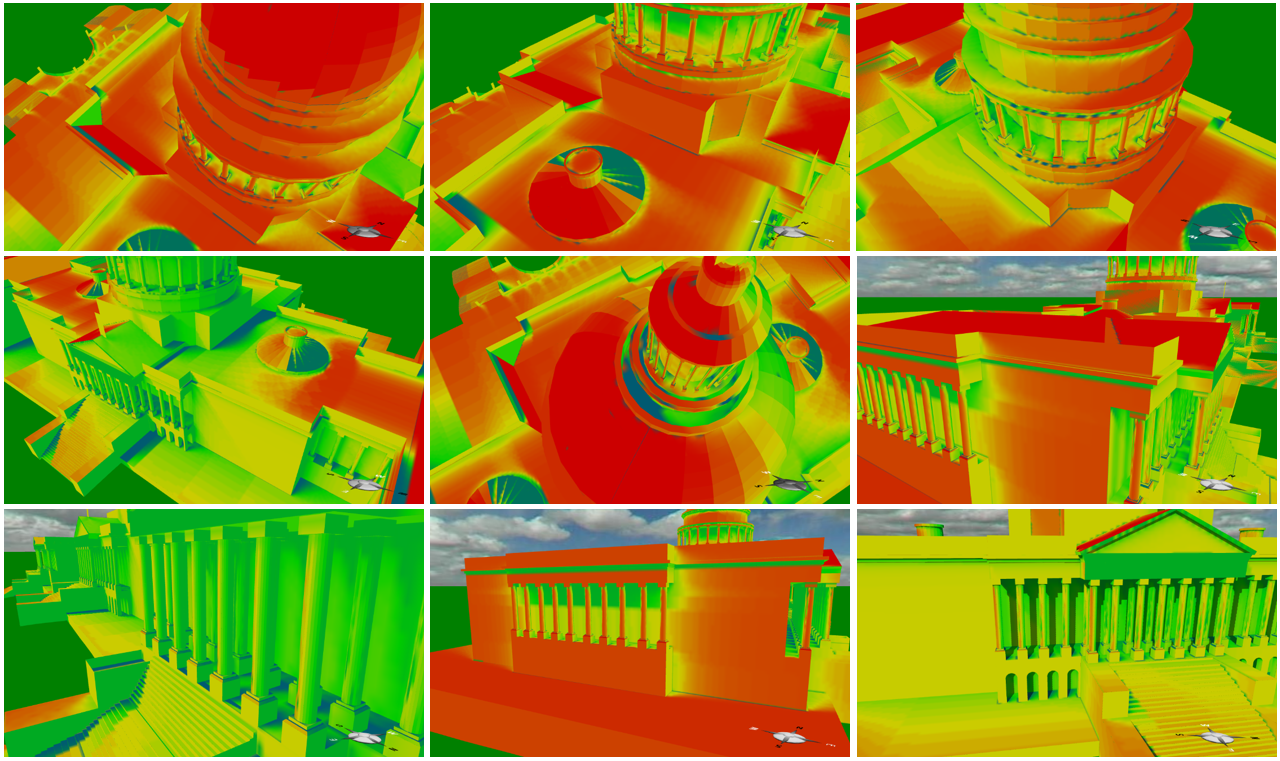
Accurate solar radiation modeling
Solar irradiance heat map visualizes the distribution of solar radiation on surfaces on a daily basis,
which may be useful for natural daylighting and solar potential analyses.
The examples below show the results for the lower Manhattan Island in New York City and the U.S. Capitol Building in Washington DC.
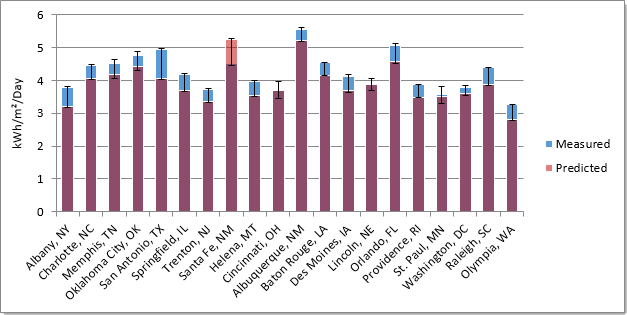
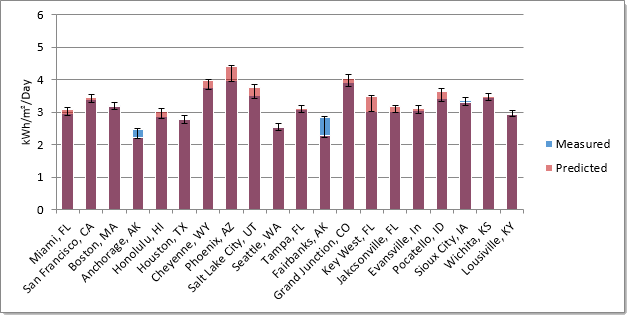
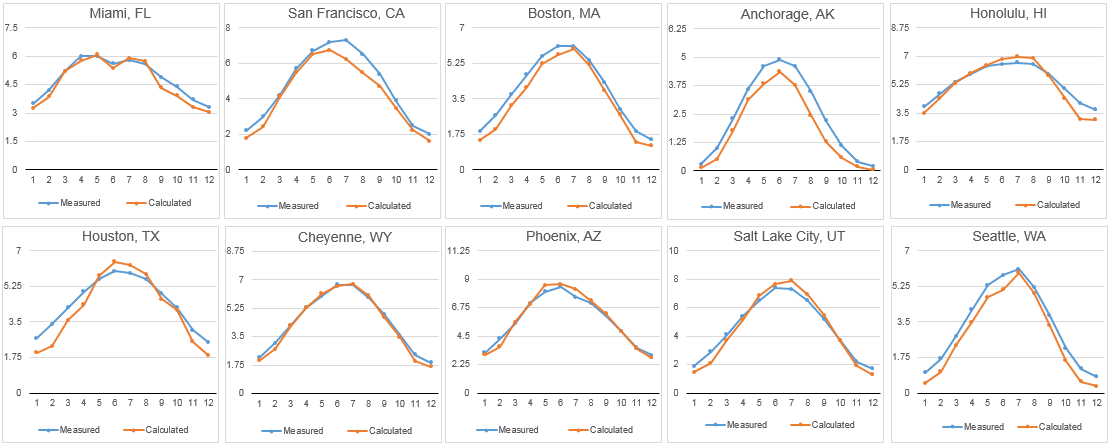
Averaged over 150 U.S. locations, the mean daily insolation predicted by Energy3D is within ±14% of the measured result for a horizontal surface
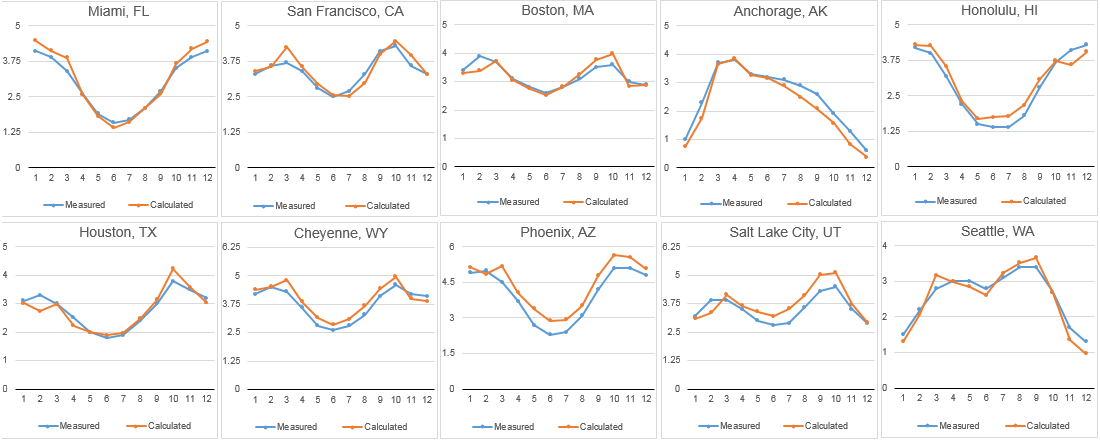
and ±10% for a south-facing vertical surface, respectively. The following images show the comparison of calculated and measured data for 20 U.S. cities.
The measured data are from
the National Solar Radiation Data Base collected by the U.S. Department of Energy.
Insolation on a horizontal surface (monthly breakdown):
Insolation on a south-facing vertical surface (monthly breakdown):
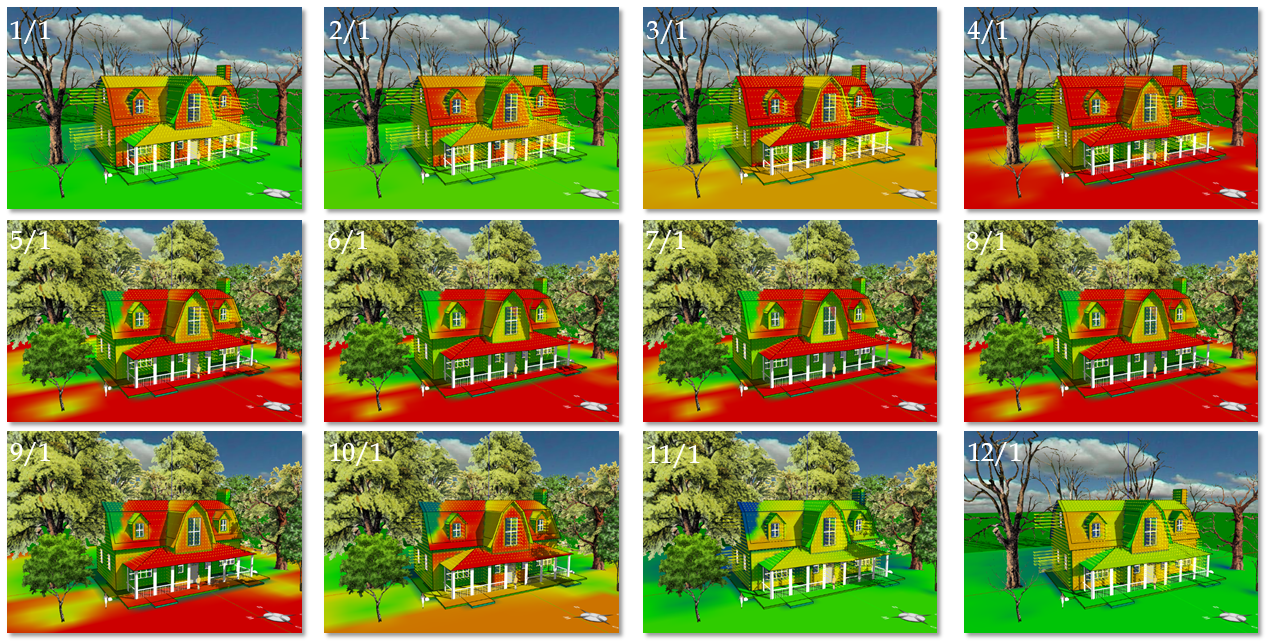
Intuitive building performance analysis
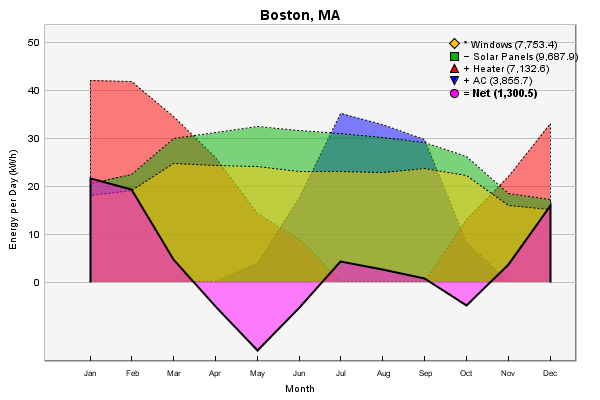
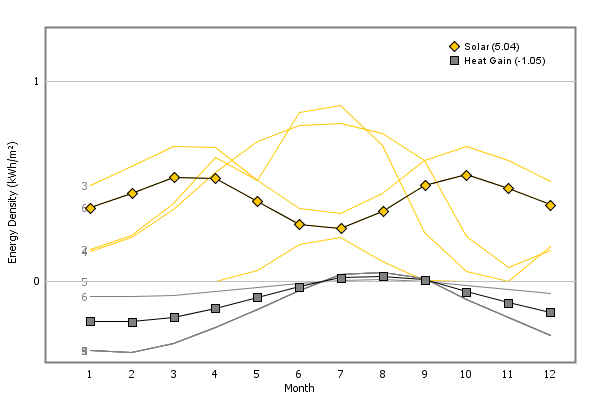
Twelve-month solar irradiance heat maps and heat flux vectors on the building envelope of a house (location: Boston, MA):
Energy usage and sensor graphs:
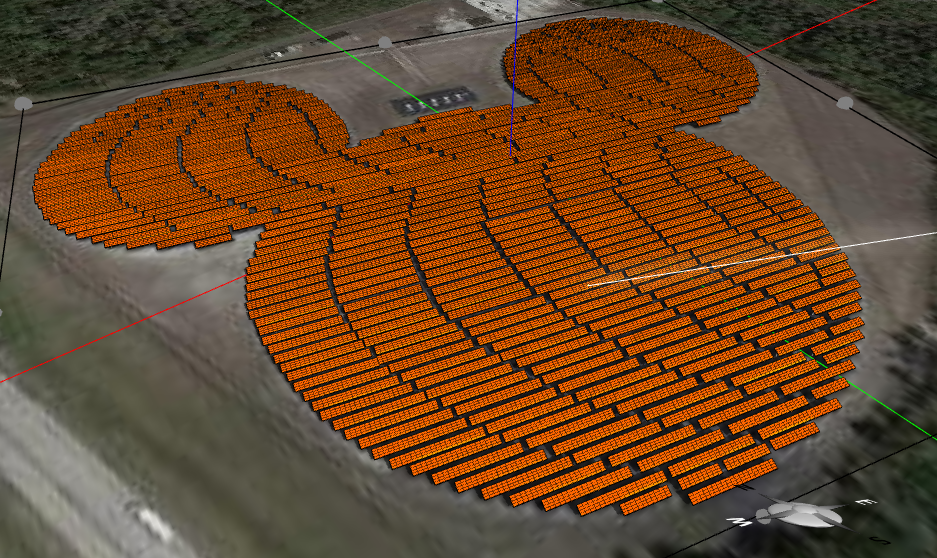
Solar power station design and analysis
Energy3D supports the design, simulation, analysis, and optimization of both photovoltaic solar power stations and concentrated solar power stations.
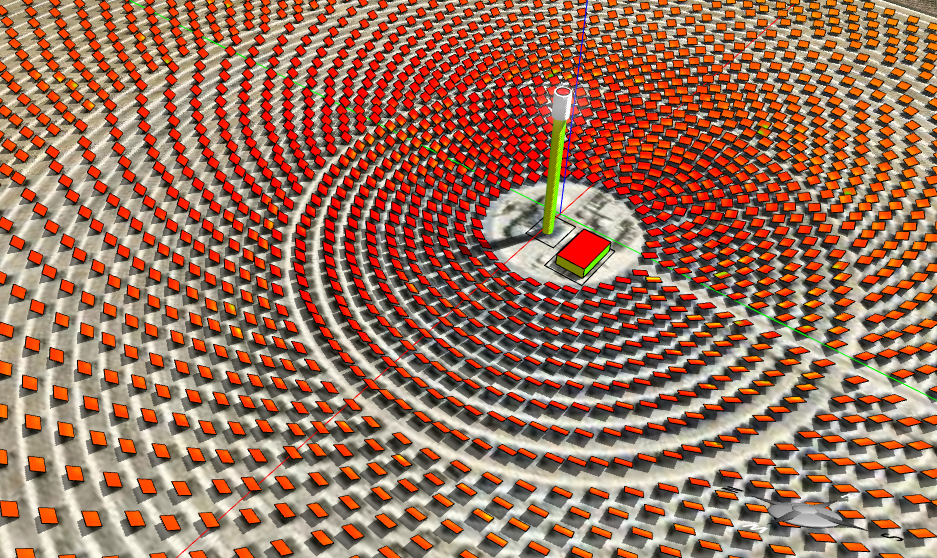
The examples below show the
5 MW Mickey Mouse-shaped photovoltaic solar farm in the Disney World in Orlando, Florida, USA
and the Gemasolar Thermosolar Plant in Fuentes de Andalucia, Sevilla, Spain.
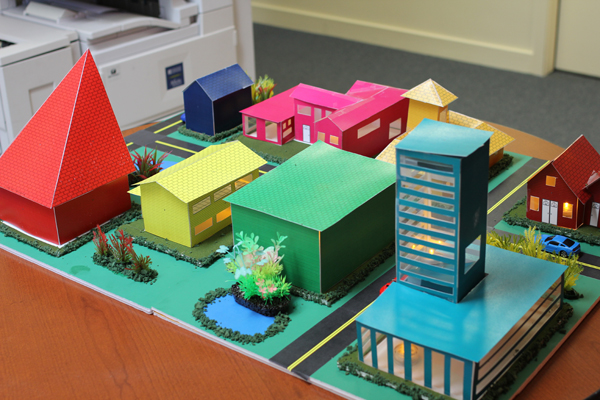
Printed paper scale models
Energy3D can automatically break down a 3D structure into 2D pieces that can be printed out, cut, and assembled into a paper scale model.