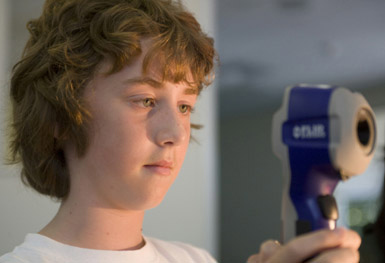
We are developing a unique approach that uses affordable IR cameras (e.g., the $249 FLIR ONE) to visualize invisible energy flows and transformations in easy-to-do science experiments. Using this "desktop remote sensing" approach, thermal energy can be readily "seen." Other types of energy that convert into thermal energy can be inferred from thermal signals. Hence, many invisible physical, chemical, and biological processes that absorb or release heat can be visualized, discovered, and investigated.
Experiments
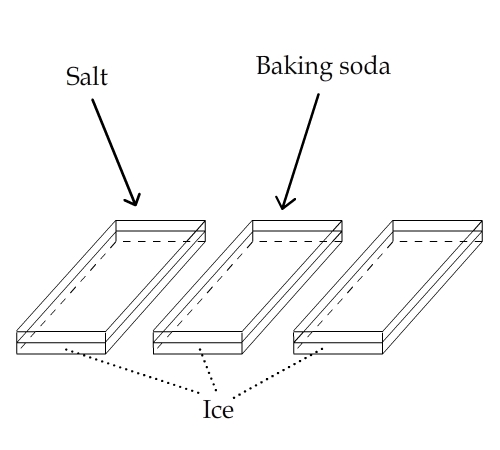
Adding Baking Soda and Salt to Ice
This video shows that adding baking soda to ice hardly melts ice, compared with adding salt.
Read more »
« Link to this
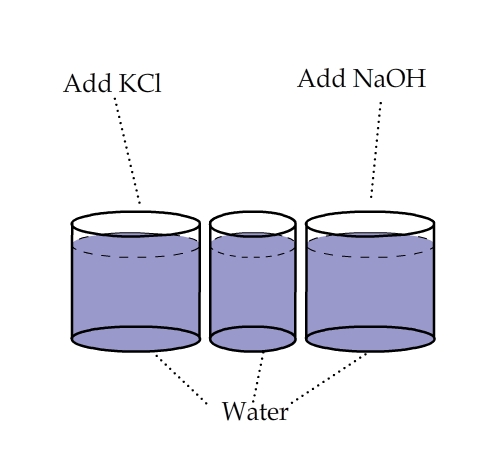
Comparing Heats of Solution: KCl vs. NaOH
An IR video of ~15g KCl in 75ml of water (on the left) and ~15g NaOH(s) in 75ml of water (on the right).
Contributed by Darren Binnema, The King's University College in Edmonton, Canada.
Read more »
« Link to this
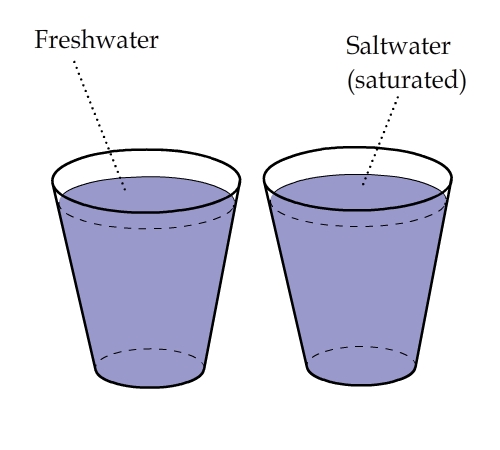
A Temperature Gradient in Saturated Saltwater
The bottom of a cup of saturated salt solution is slightly warmer than the top. This temperature gradient lasts for a long time and
does not exist in a cup of freshwater.
Read more »
« Link to this
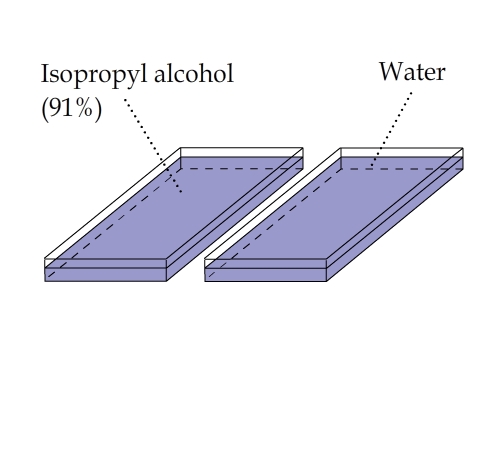
Heat of Evaporation at Room Temperature: Alcohol vs. Water
Does evaporating alcohol cool faster than water? This video provides an answer.
This experiment compared isopropyl alcohol (91%, purchased from CVS) and water in two separate containers.
It appears that the evaporative cooling effect of alcohol is slightly more significant than that of water.
Read more »
« Link to this
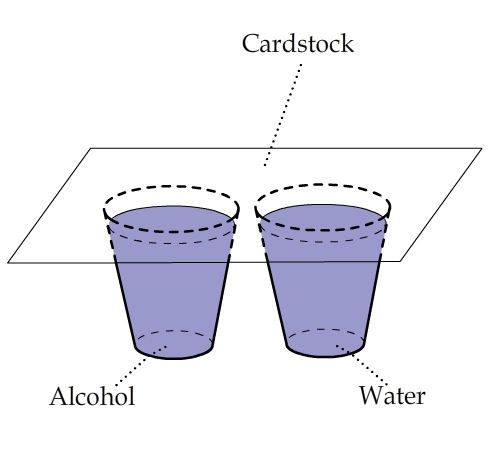
Latent Heat of Condensation: Alcohol vs. Water
A piece of cardstock was placed on top of a cup of alcohol and a cup of water.
This video shows that the portion of the cardstock above water warmed up more than the portion of the cardstock above alcohol.
Read more »
« Link to this
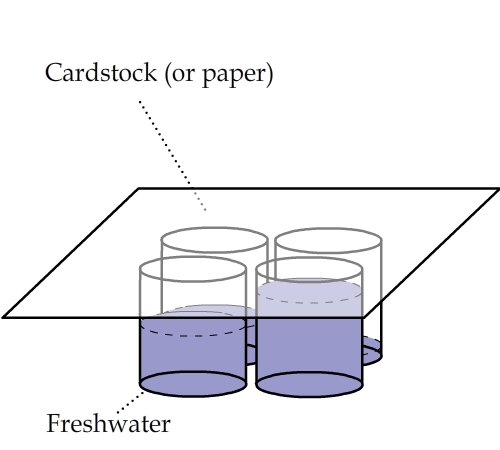
Vapor Concentration vs. Height from the Water Level
Four identical china cups were filled with different amounts of water. A piece of cardstock was placed on top of them.
This video shows that the condensation heating effect was the strongest above the nearly filled cup and the weakest above the nearly empty cup.
Read more »
« Link to this
The Attack of Surface Tension
The frying pan had a water layer and an oil layer. This video shows what happened when the pan was heated up to around 100°C.
Water vapor bubbles rose from the water layer below the oil layer and the surface tension drove them to the middle of the pan to form a "heat island."
Read more »
« Link to this

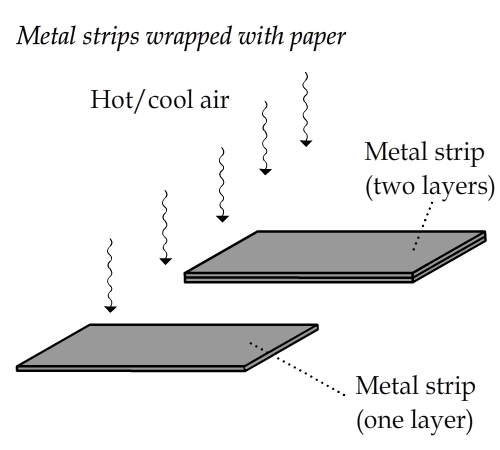
Heat Capacity: The Ability to Store Heat
Two metal strips of the same length and width but different thicknesses (one of them is twice as thick as the other)
were placed under a hot air fan. The thicker one warmed up more slowly but was able to retain heat longer after the fan switched to the cool air mode.
Read more »
« Link to this
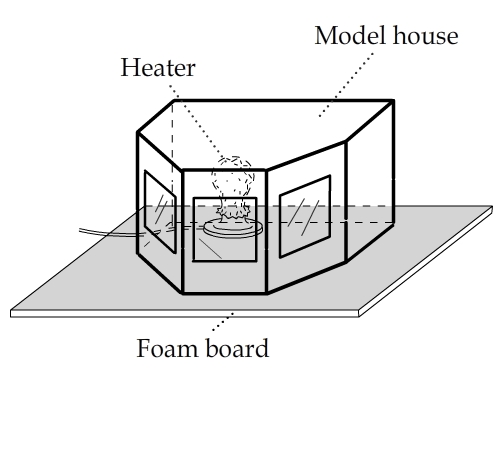
Which Window Loses Most Energy?
A heated model house has three windows. One of them has double panes. The other two have a single pane.
Can you tell which one is the double-pane window from this IR video?
Read more »
« Link to this
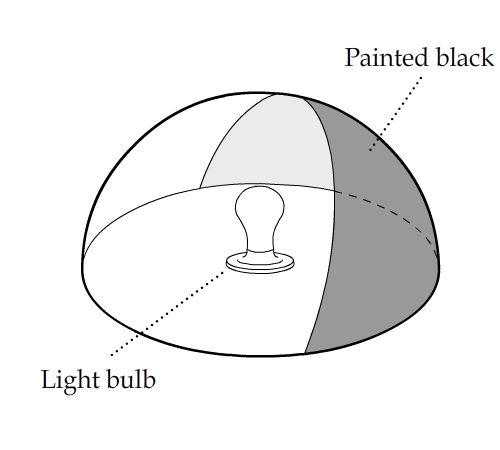
Conduction, Convection, and Radiation from a Light Bulb
A half sphere made of white cardstock was heated by a light bulb placed at the center of the base plane. The right part of the half sphere was painted black inside.
The light was turned off after a while. This video shows the change of temperature pattern on the surface of the sphere.
Read more »
« Link to this